The 2026 NFL engine overhaul
Play Profiles on every player, a cash and GPP switch that re-prices the whole app, ownership badges, bring-back stacks, stadium weather, and 10,000 simulations per slate.
Know what each player is for before you click him.
Every player is tagged Core Cash, GPP Boom, Leverage, or Fragile Chalk, and rated 1 to 5. Stars rate cash safety. Flames rate tournament ceiling. A player who is both gets a split pill. The ratings come from 10,000 simulated games of the slate.
Cash-safety stars measure floor stability and floor-to-salary ratio. Tournament-ceiling flames measure 85th-percentile upside and boom probability.
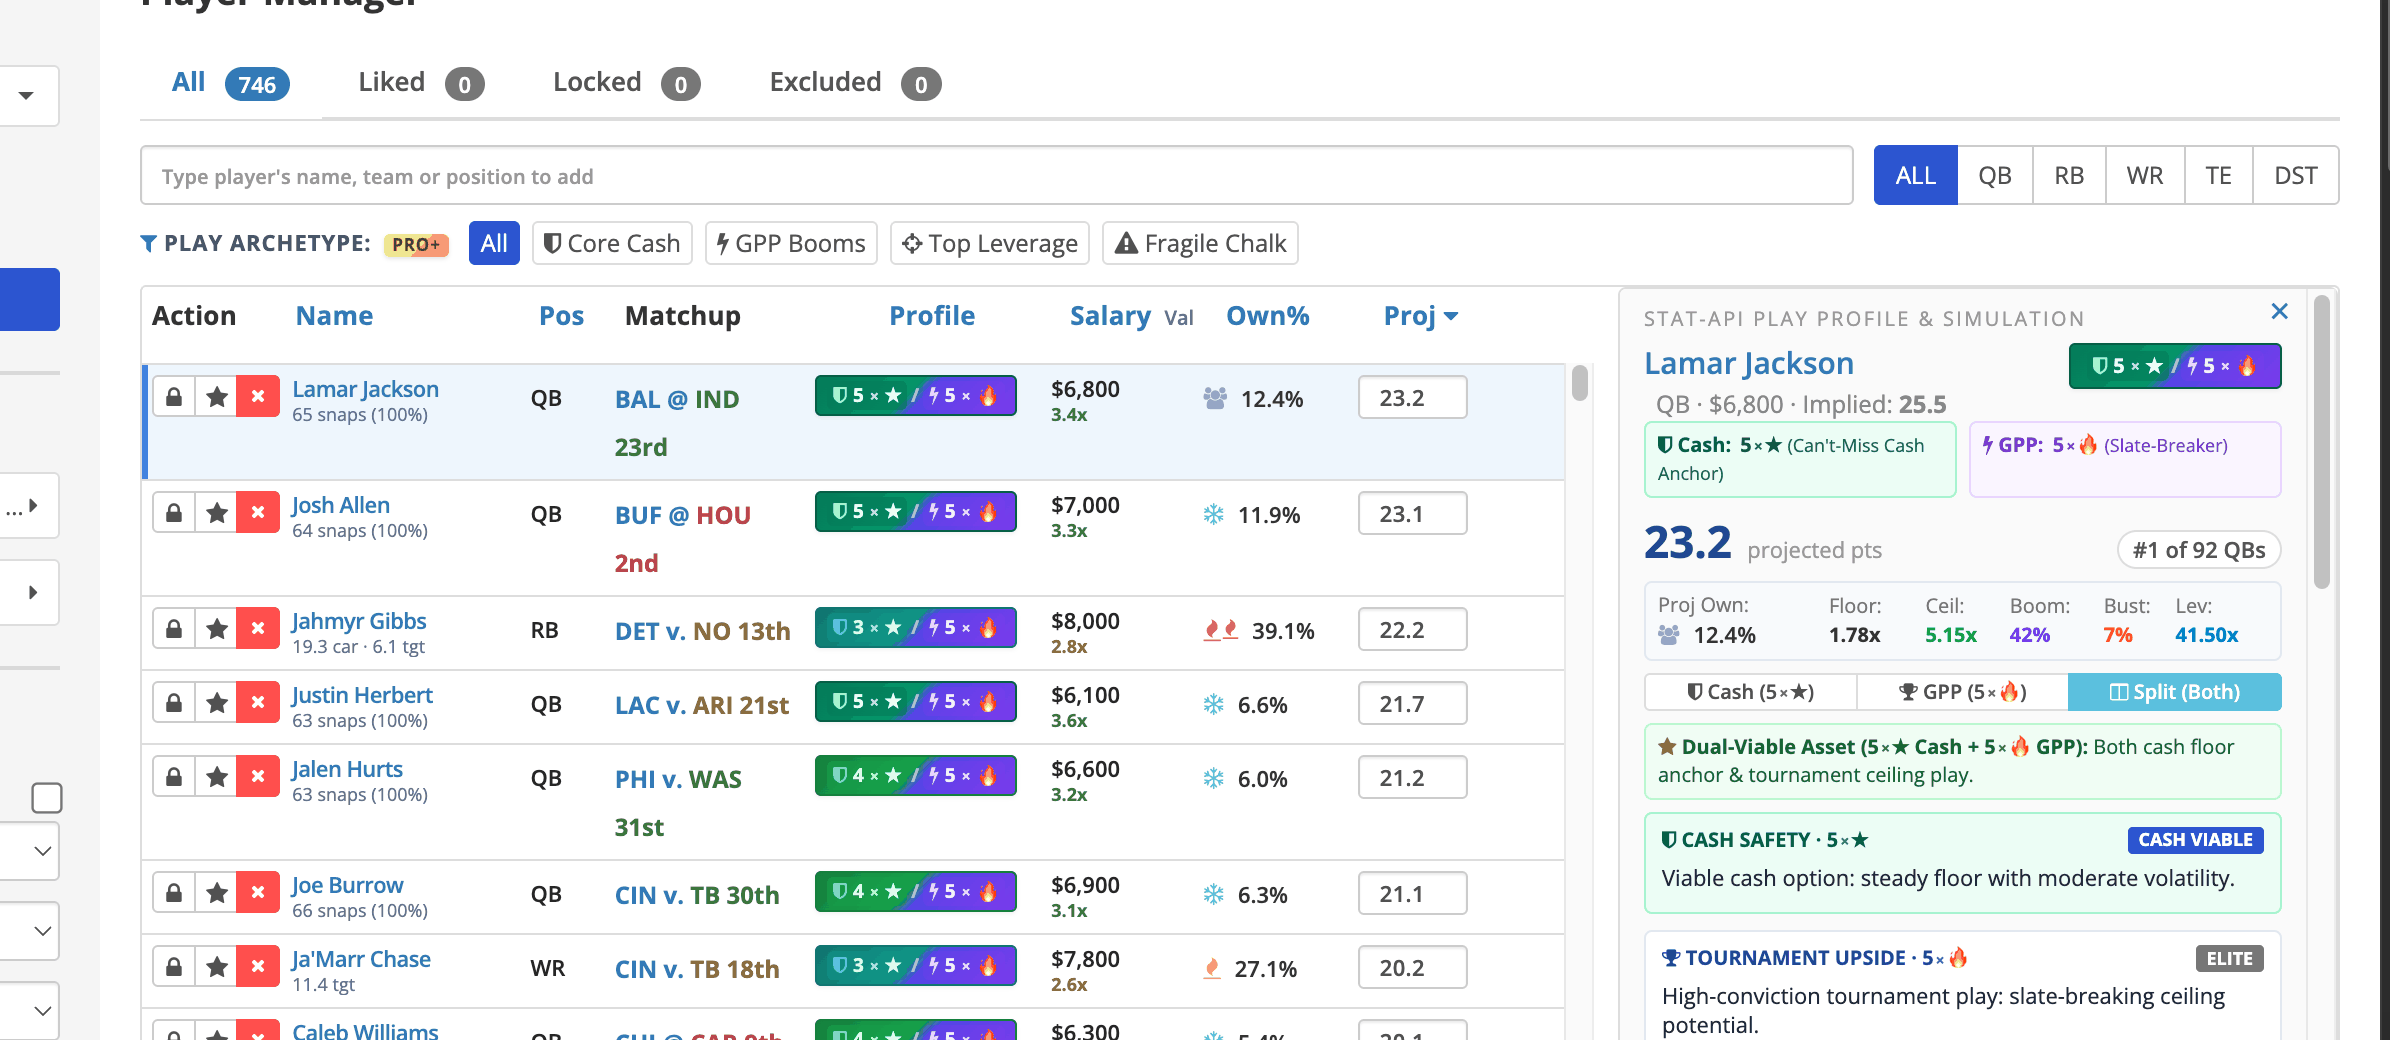
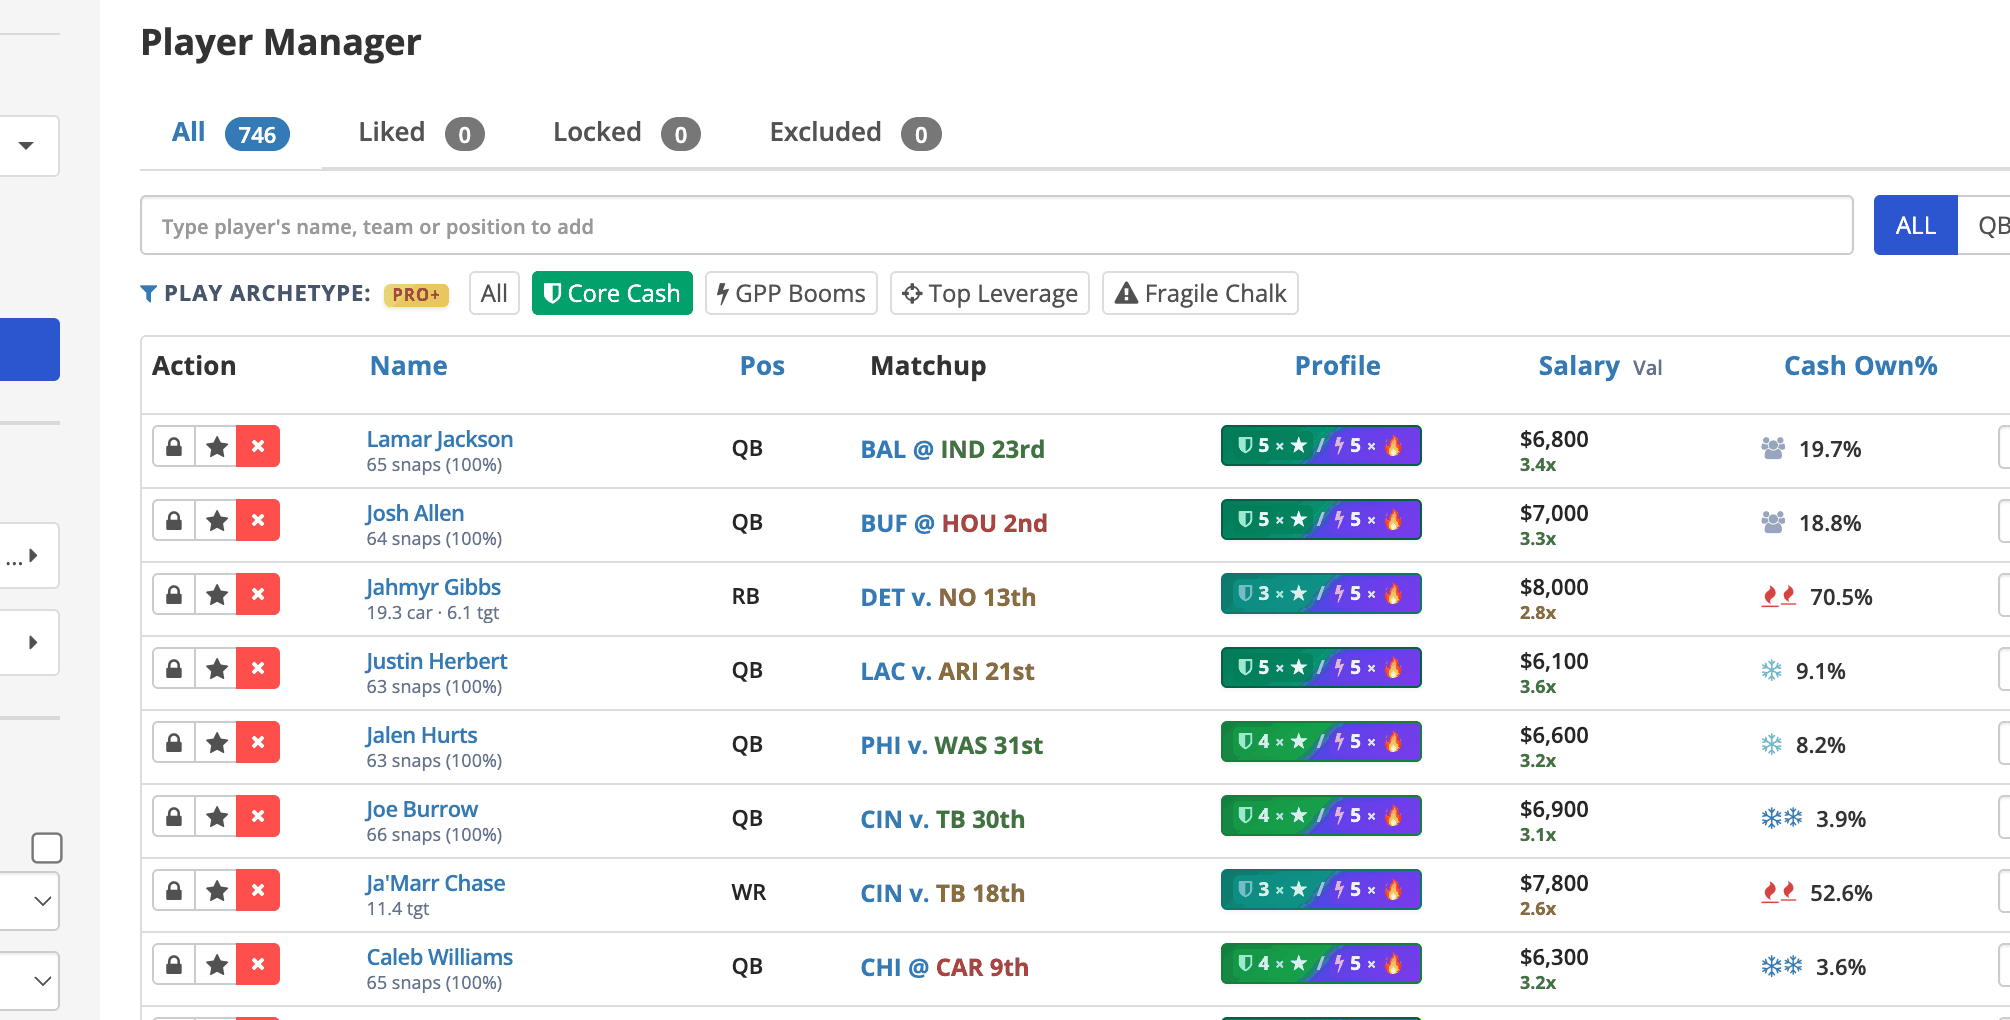
One switch. The whole app re-prices.
Flip the toggle at the top of the lineup builder. Ownership becomes cash ownership, the Profile column re-sorts to stars instead of flames, and every popover opens on the cash read.
Cash ownership is its own number, projected for 50/50s and double-ups, not a rescaled tournament figure. The app remembers your choice.
Chalk and fade, without reading a number.
Projected ownership sits next to every salary as a badge. Two flames is the field. Two snowflakes is nobody. Hover for the tier and the range.
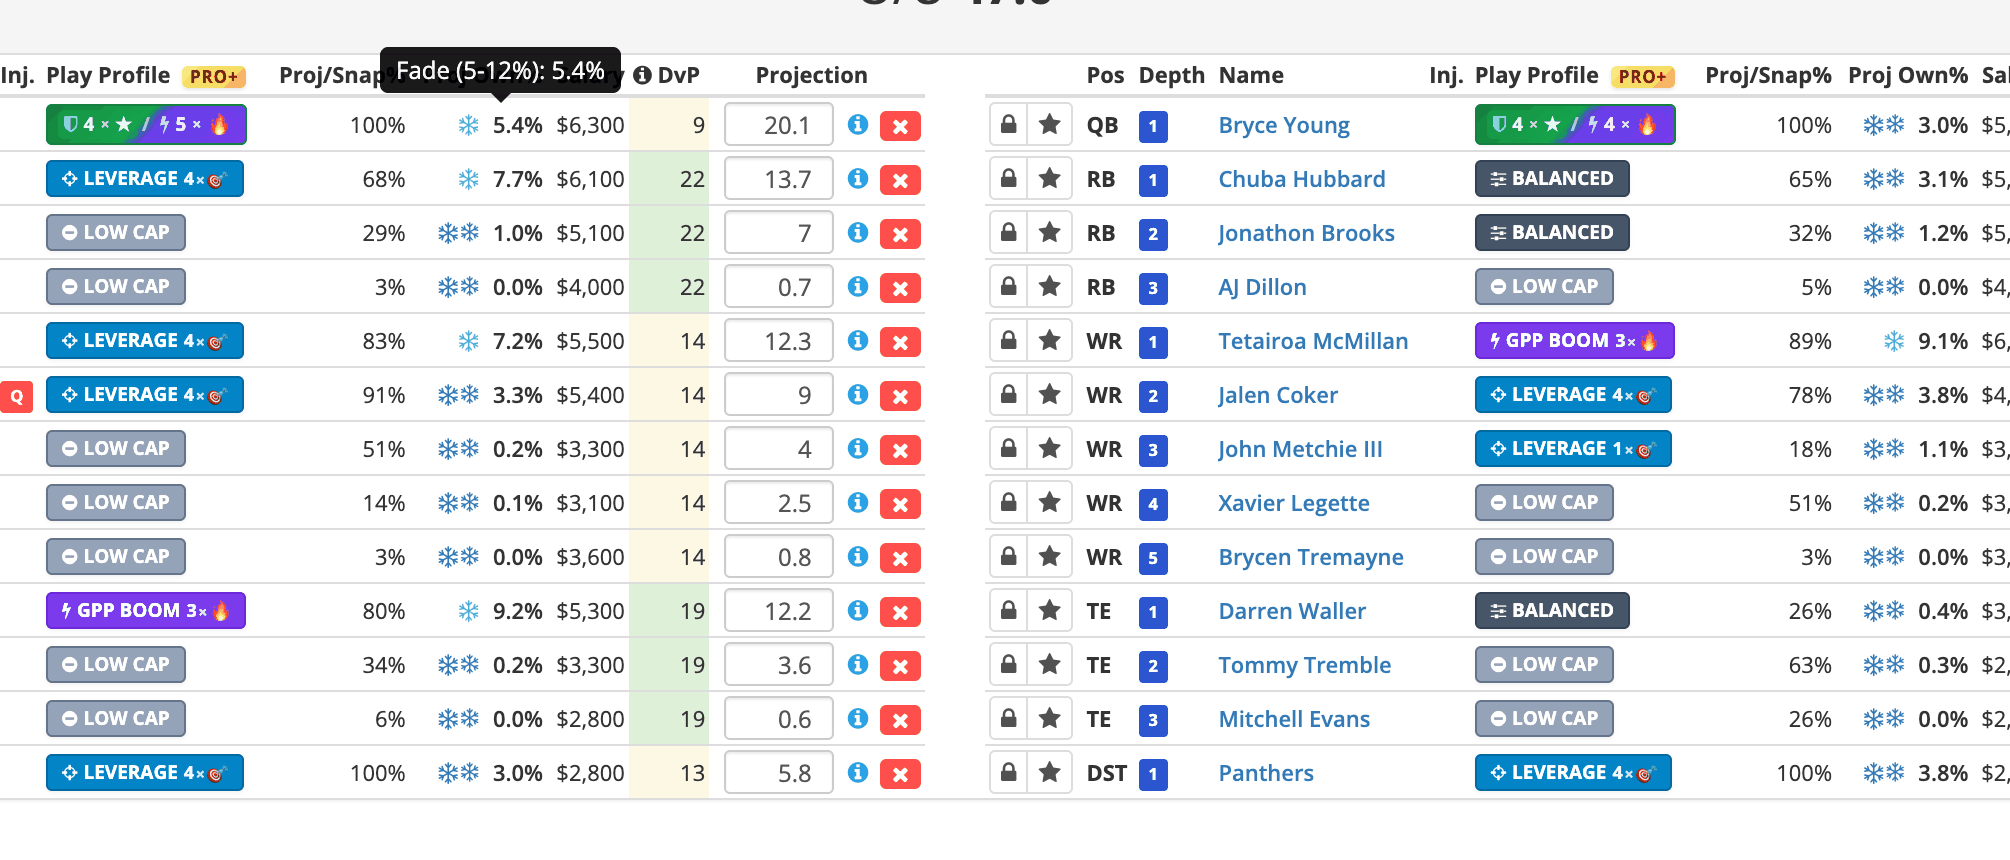
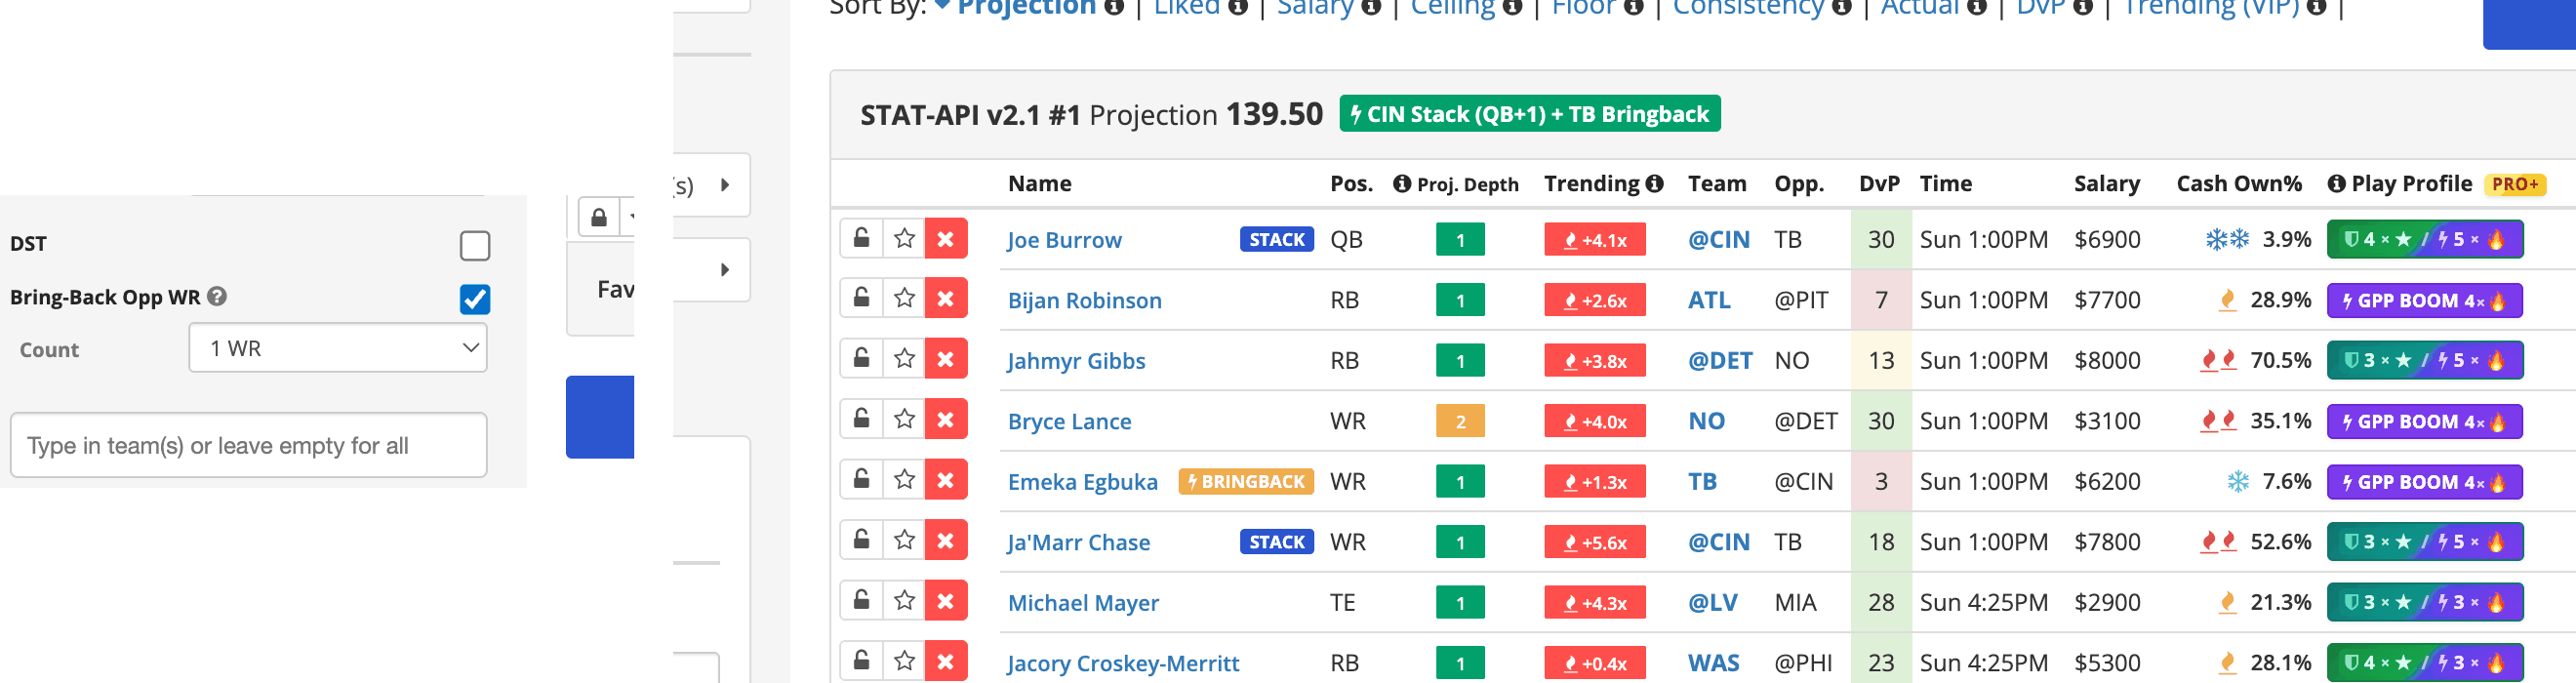
Stacks that stay stacked, with a bring-back.
Tick Bring-Back Opp WR and every lineup adds one or two receivers from the other side of your primary stack. Each lineup card names its stack, so you can see the game stack without counting jerseys.
The optimizer no longer trades a stack member for a value play after you asked for the stack. What you ask for is what you get. A 2,000-lineup build now finishes in about a second.
The wind, drawn on the field.
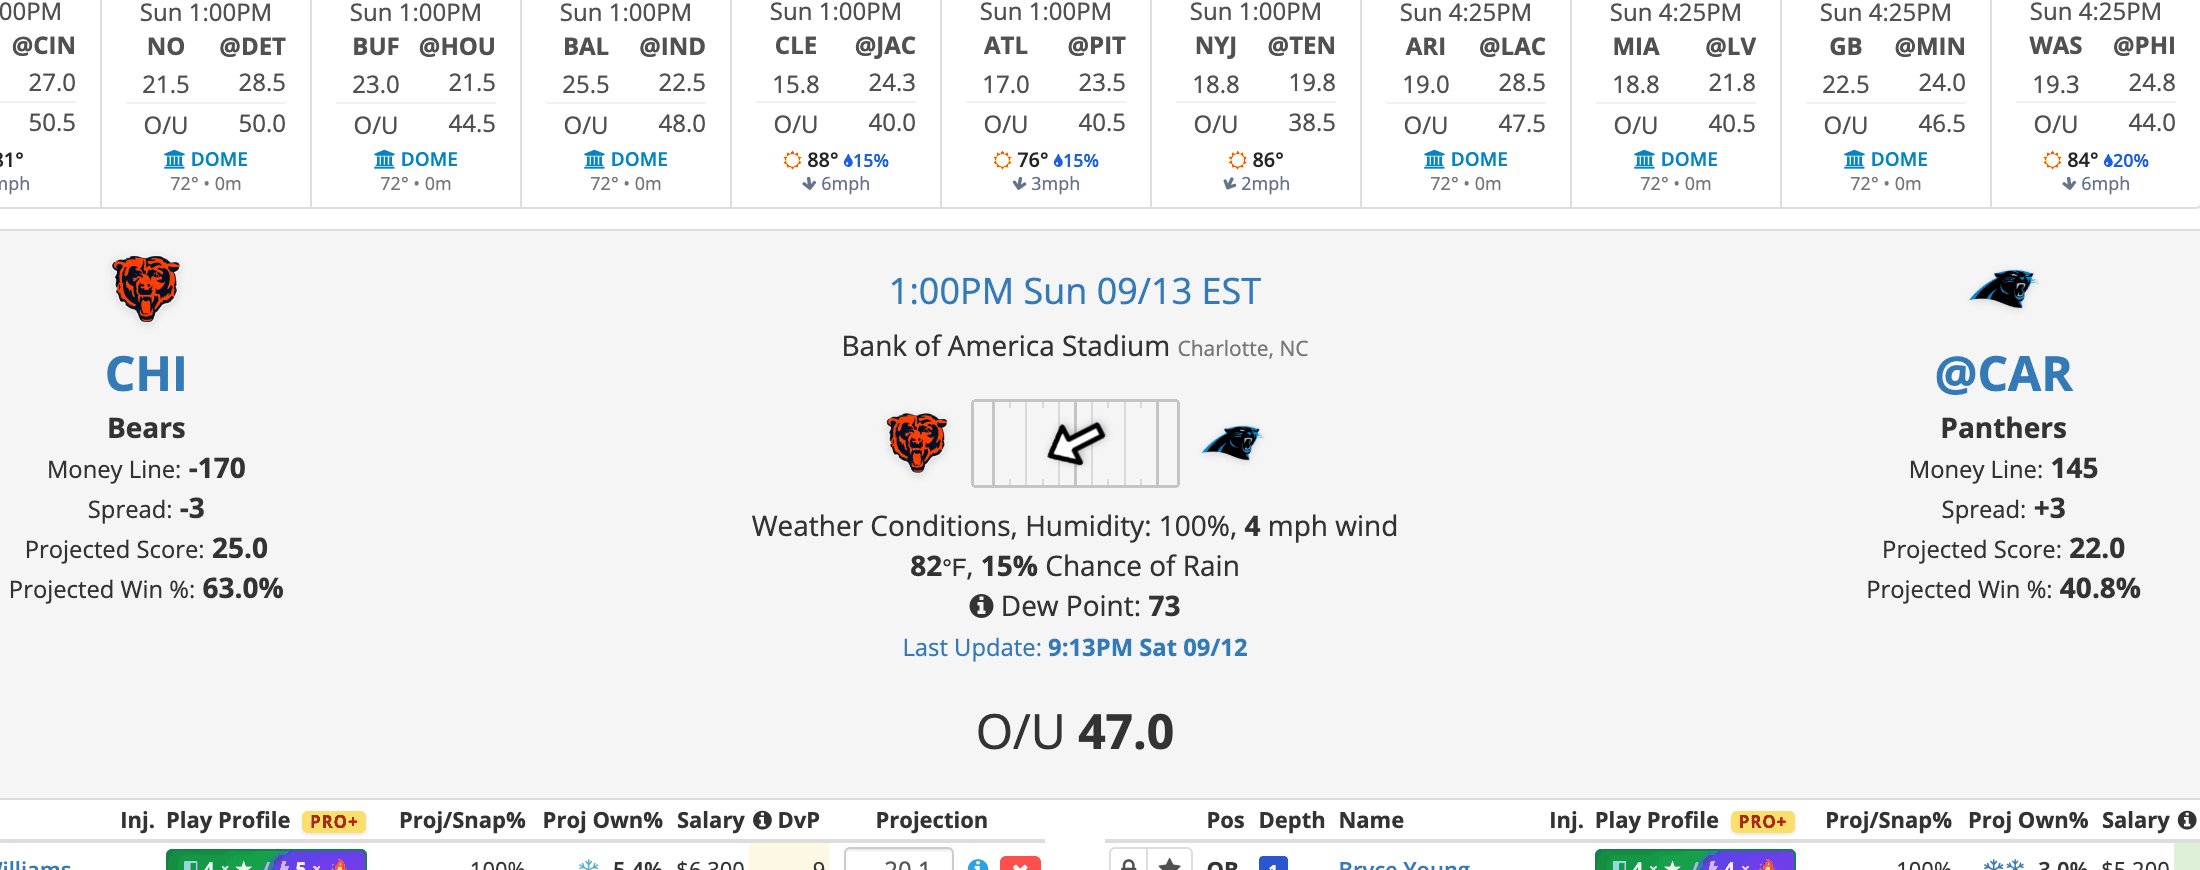
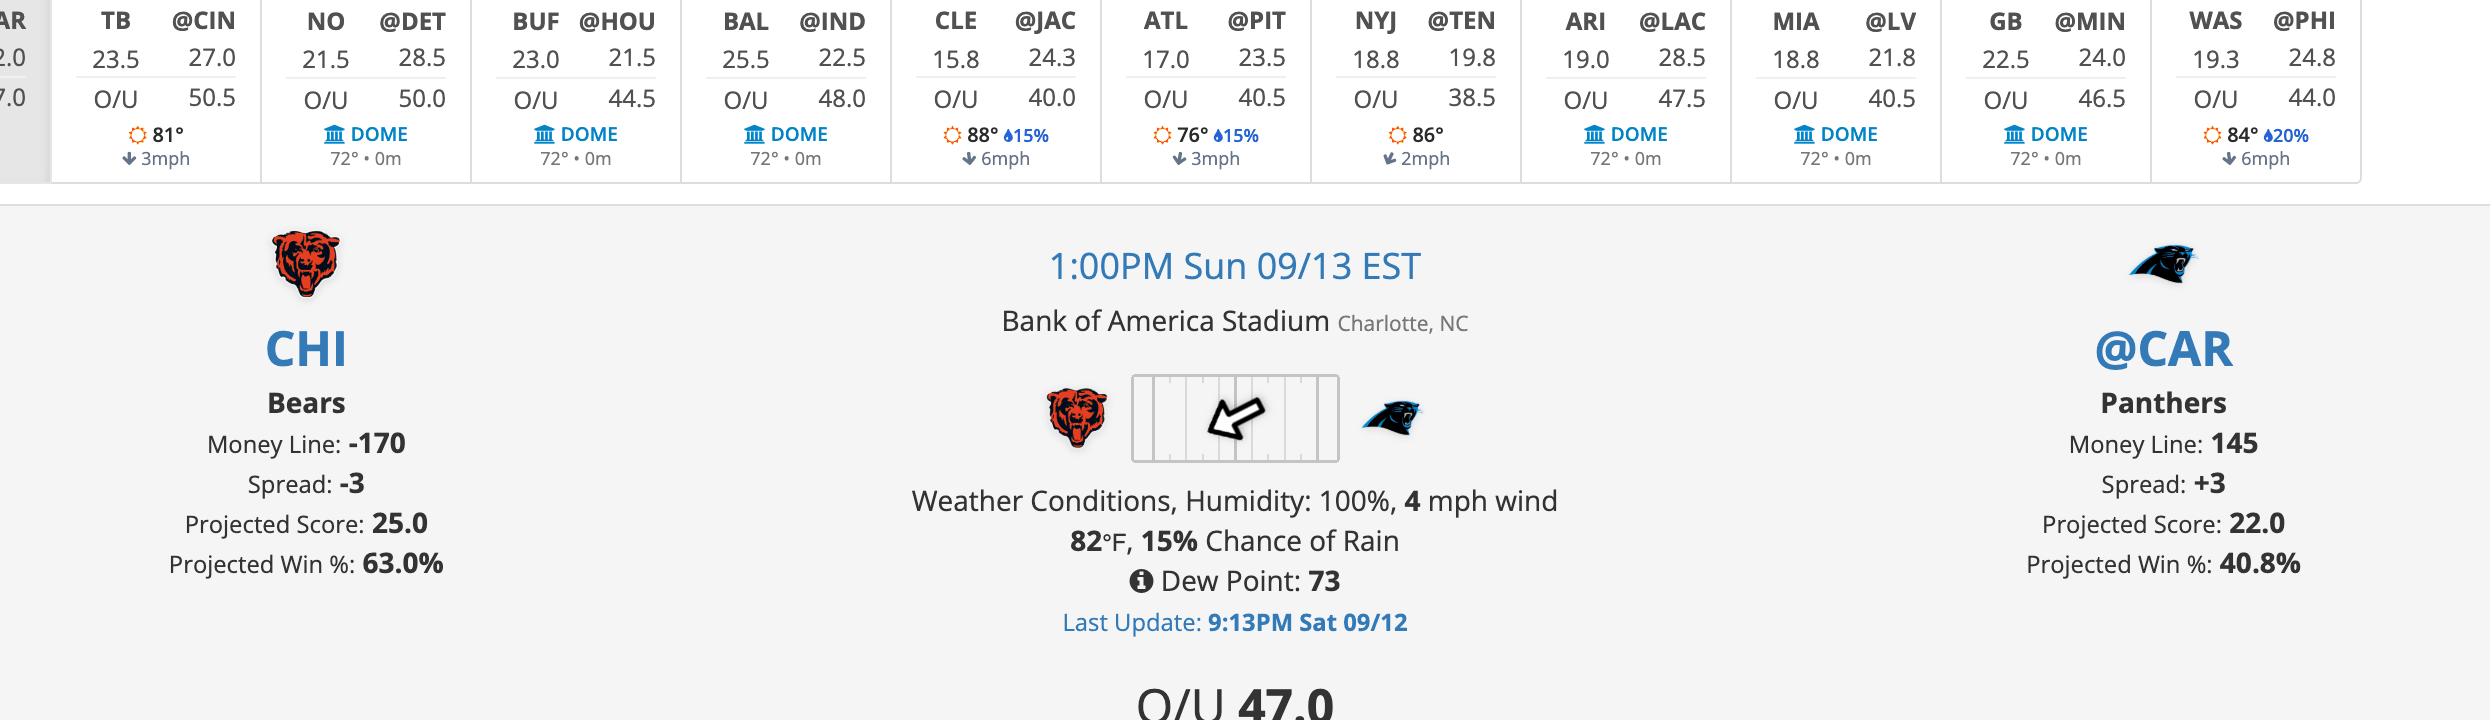
Every outdoor game shows the wind as an arrow on the field, rotated to the true bearing against the stadium's orientation. Temperature, rain chance, humidity and a plain read on what the wind does to the passing game sit under it.
The curve, not just a number. Floor, median, ceiling.
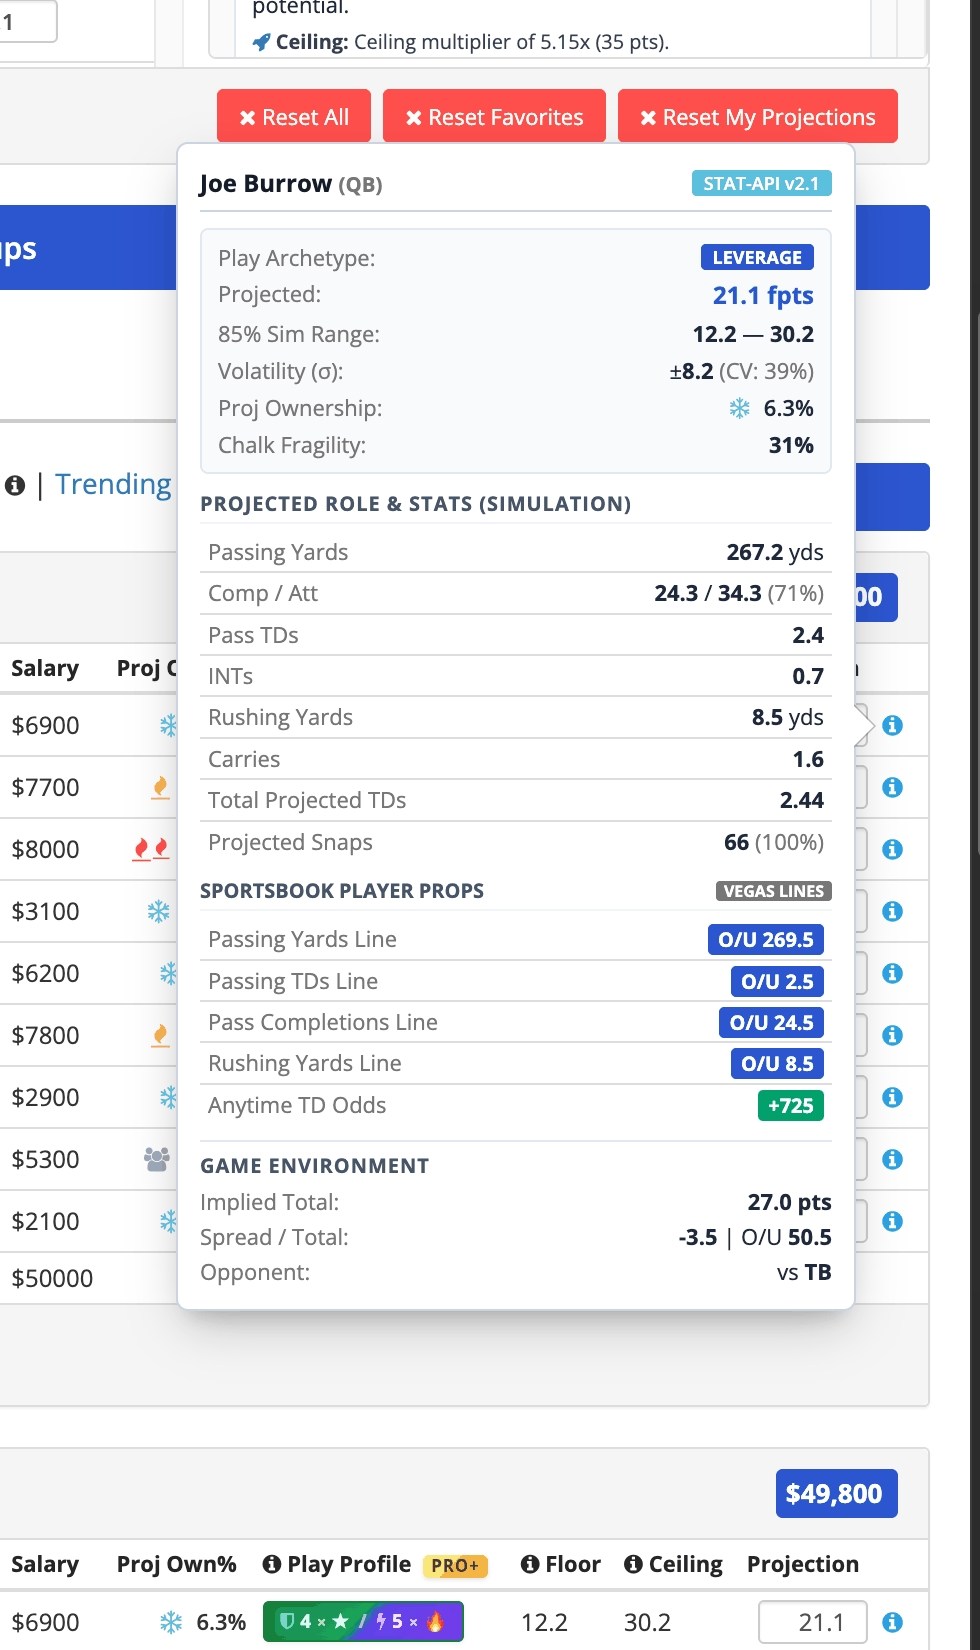
Single-number projections hide the variance that decides tournaments. Every player in RotoQL now carries an outcome distribution modeled from 10,000 Monte Carlo game simulations: 15th percentile floor, 50th percentile median, and 85th percentile ceiling.
Hover any projection for the distribution quick-bar. Click “Why this projection?” on any player in the lineup table or depth chart to inspect simulated passing and rushing volume, target and snap rates, Vegas game environments, and live sportsbook player props.
Sort the field by 90th-percentile ceiling.
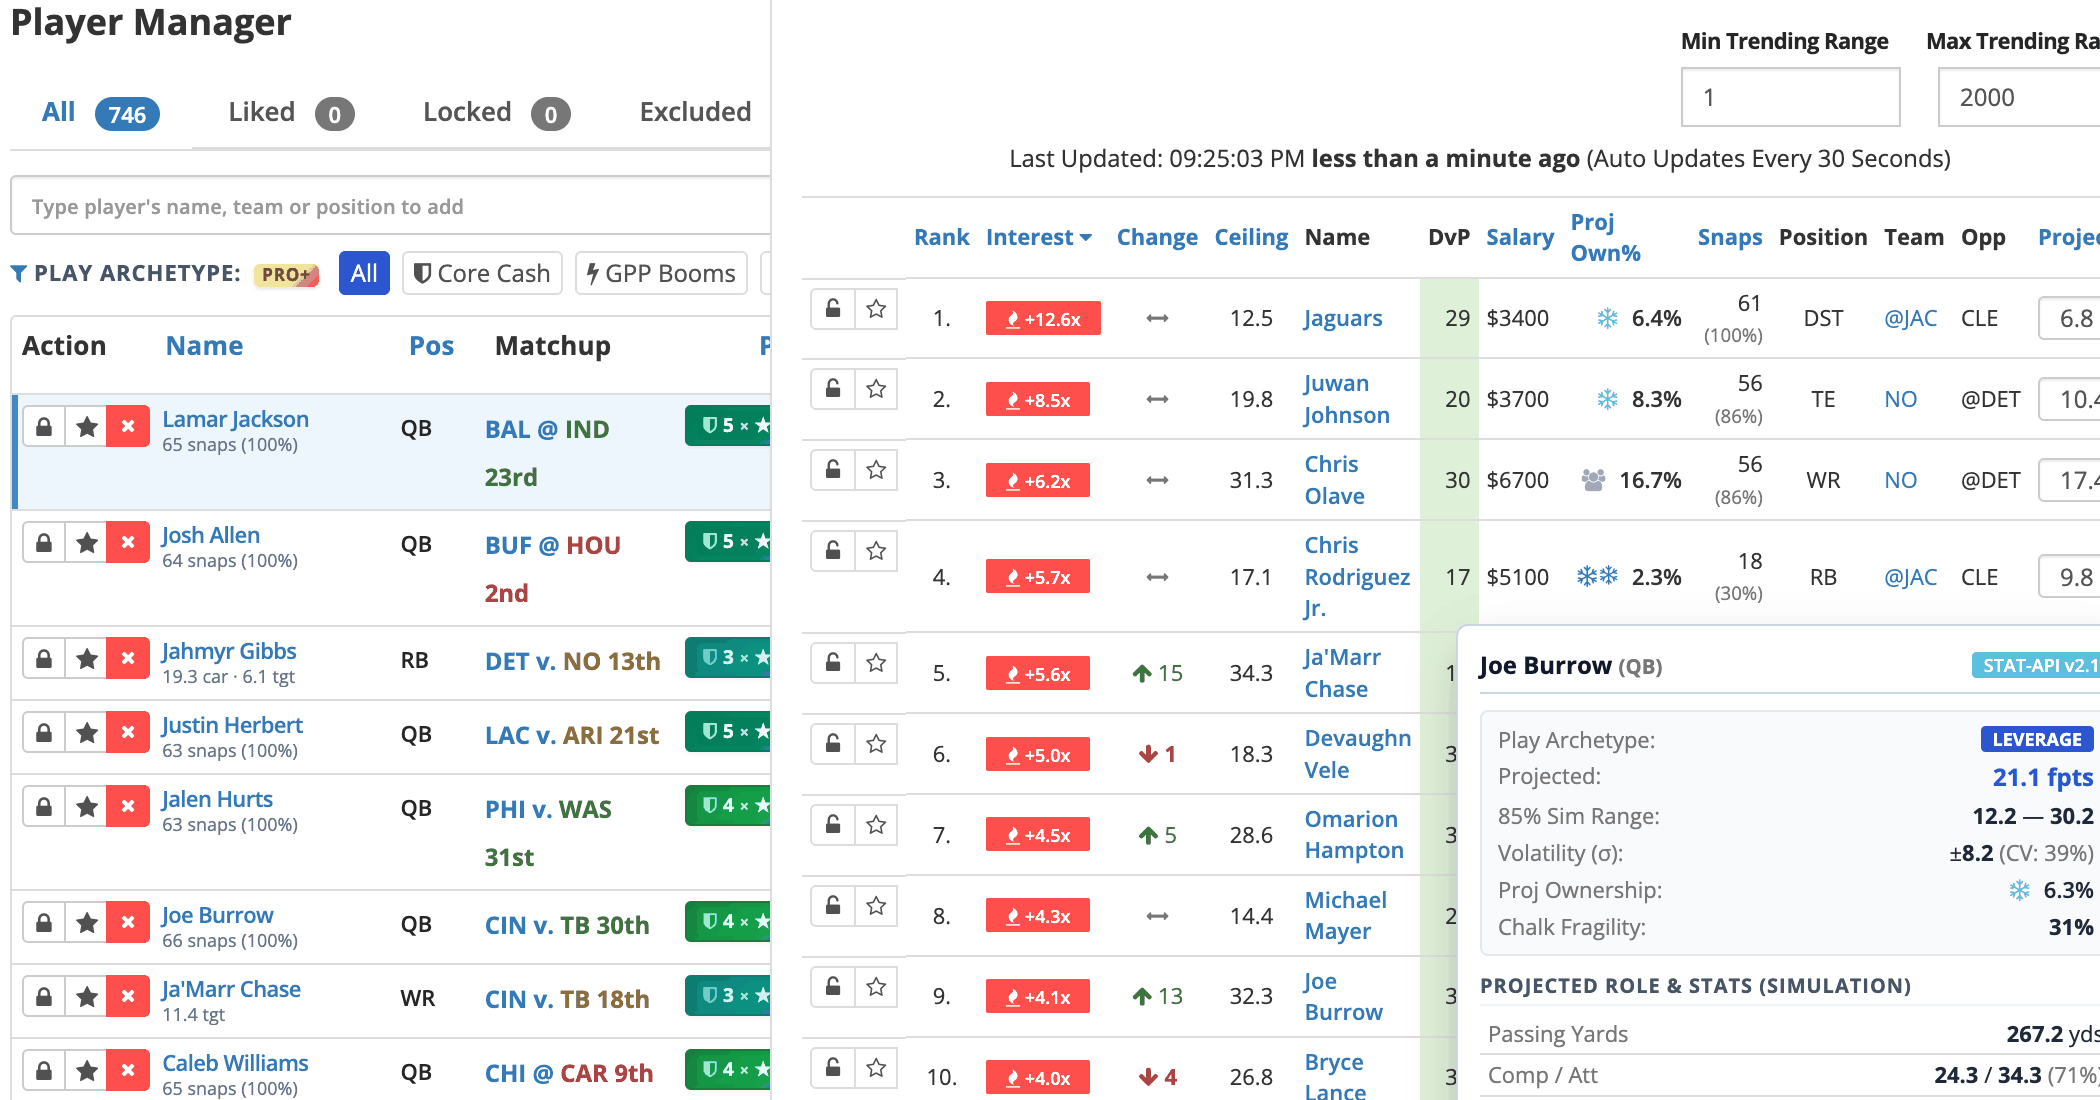
In large-field tournaments, median scores don't win slates—high-percentile spikes do. The real-time Trending drawer now features a dedicated, sortable Ceiling column powered by each player's 90th-percentile simulation score.
Pair live field sentiment velocity with raw ceiling potential in one unified view. See where community exposure is chasing upside (like Ja'Marr Chase at 34.3 or Jahmyr Gibbs at 38.2 ceiling) and isolate low-owned leverage plays before the crowd moves.
Every one of these is live right now.
Play this week's free Classic slate. No card.
Open the optimizer